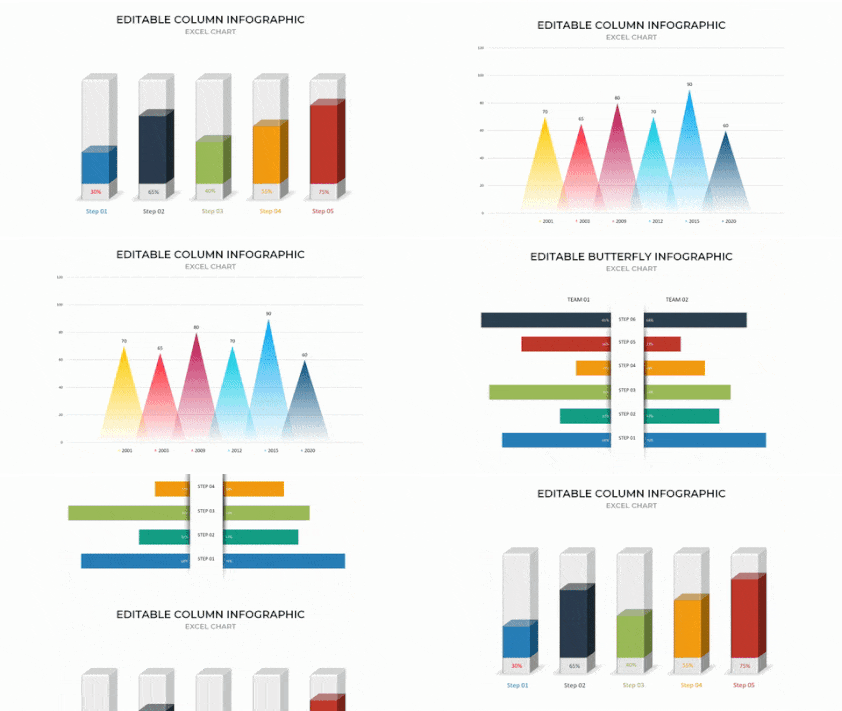
In today’s data-driven world, presenting information clearly and effectively is crucial. Whether you’re in business, education, or any other field, turning complex data into easily digestible visuals can make a significant difference in your presentations. That’s where our Excel-Linked Infographic PowerPoint Templates come in. These templates are designed to help you create stunning, informative, and professional presentations that make your data shine.
Why Choose Excel-Linked Infographic PowerPoint Slides?

https://presentationpro.com/powerpoint-templates-713-excel-linked-infographics.aspx
Seamless Data Integration
One of the standout features of our templates is the seamless integration with Excel. This means you can link your PowerPoint slides directly to your Excel spreadsheets, ensuring your data is always up-to-date. Any changes made in Excel are automatically reflected in your PowerPoint presentation, saving you time and reducing the risk of errors.
Versatile and Customizable
Our templates offer a variety of infographic styles, including charts, graphs, and diagrams. Each element is fully customizable, allowing you to tailor the visuals to match your branding and presentation needs. Whether you need to highlight key data points, show trends over time, or compare different sets of data, our templates have you covered.
High-Quality Graphics
Quality is paramount when it comes to data visualization. Our templates feature high-resolution graphics that look stunning on any screen size. This ensures that your presentation maintains its professional appearance, whether viewed on a projector, computer monitor, or mobile device.
Key Features of Excel-Linked Infographic Templates
1. Dynamic Charts and Graphs
- Real-Time Updates: Link your data to Excel for real-time updates.
- Customization: Modify colors, labels, and styles to fit your presentation theme.
- Variety: Choose from bar charts, line graphs, pie charts, scatter plots, and more.
2. Interactive Elements
- Hover Effects: Add interactivity with hover effects to reveal additional information.
- Clickable Links: Embed links within your infographics for a more interactive experience.
3. SmartArt Integration
- Visual Storytelling: Use SmartArt to convert bullet points into visually appealing diagrams.
- Ease of Use: Simple to insert and customize to fit your narrative.
4. Professional Templates
- Consistency: Maintain a consistent look and feel throughout your presentation.
- Time-Saving: Pre-designed templates save you time, allowing you to focus on content rather than design.
Use Cases for Excel-Linked Infographic Templates
Business Reports
Present financial data, sales performance, and market analysis clearly and concisely. With real-time updates, ensure your stakeholders always see the most current information.
Educational Presentations
Make complex information accessible to students by transforming raw data into engaging and interactive visuals. Ideal for explaining scientific data, historical trends, or statistical information.
Marketing Strategies
Showcase campaign results, consumer insights, and market trends effectively. Impress clients and stakeholders with professional, data-driven presentations.
Project Management
Track project progress, resource allocation, and timelines with easy-to-understand visuals. Keep your team informed and aligned with the project’s status and goals.
How to Get Started
Using our Excel-Linked Infographic PowerPoint Templates is simple. Download the template that fits your needs, link it to your Excel data, and start customizing. Here’s a quick guide to get you started:
- Download the Template: Visit the Excel-Linked Infographic Templates page and choose the template that suits your needs.
- Link to Excel: Open the template in PowerPoint and link it to your Excel data source.
- Customize: Adjust colors, labels, and other elements to match your presentation style.
- Update and Present: As your data changes, simply update the Excel file, and your PowerPoint will reflect those changes automatically.
By integrating these infographic designs into your workflow, you’ll save time, reduce errors, and create presentations that leave a lasting impact on your audience. Don’t miss out on the opportunity to elevate your data presentations with our innovative Excel-Linked Infographic PowerPoint Templates.
Get Unlimited Access to EVERYTHING
• starting at only $49
• 1 User
• Over 40,000+ Royalty Free Designs
• One Time Payment
• Unlimited downloads
• Fast & Free Support
• Early Access to AIPresentationBOOST PowerPoint AI (beta)
• Express PowerPoint addin

designs for PowerPoint and build presentations that get noticed!

